No matter how safe we attempt to be, there is always the chance that a reckless individual will drive irresponsibly and cause a collision that can seriously impact our lives.
Statistics from the Connecticut Crash Data Repository (a web-based tool that records accident data from the Connecticut Department of Transportation and the Department of Public Safety) illustrate the fatal effects of negligence behind the wheel. In 2020, the death toll in Connecticut from motor vehicle accidents increased a staggering 19.29 percent from the previous year. In total there were 303 vehicle-related deaths in 2020, compared to 254 in 2019 and 297 in 2018.
With so many tragic car accidents occurring right in our own backyard, understanding how they happen may shed some light on how to avoid them.
Contact The Flood Law Firm
No matter how careful you are, a reckless driver can make a mistake that endangers you or your entire family. The car accident lawyers at The Flood Law Firm are dedicated to representing people who have been affected by car accidents in Connecticut and need help.
If you or a loved one has been hurt in a car accident, call our offices at (860) 346-2695 today for a consultation at no cost and with no obligation.
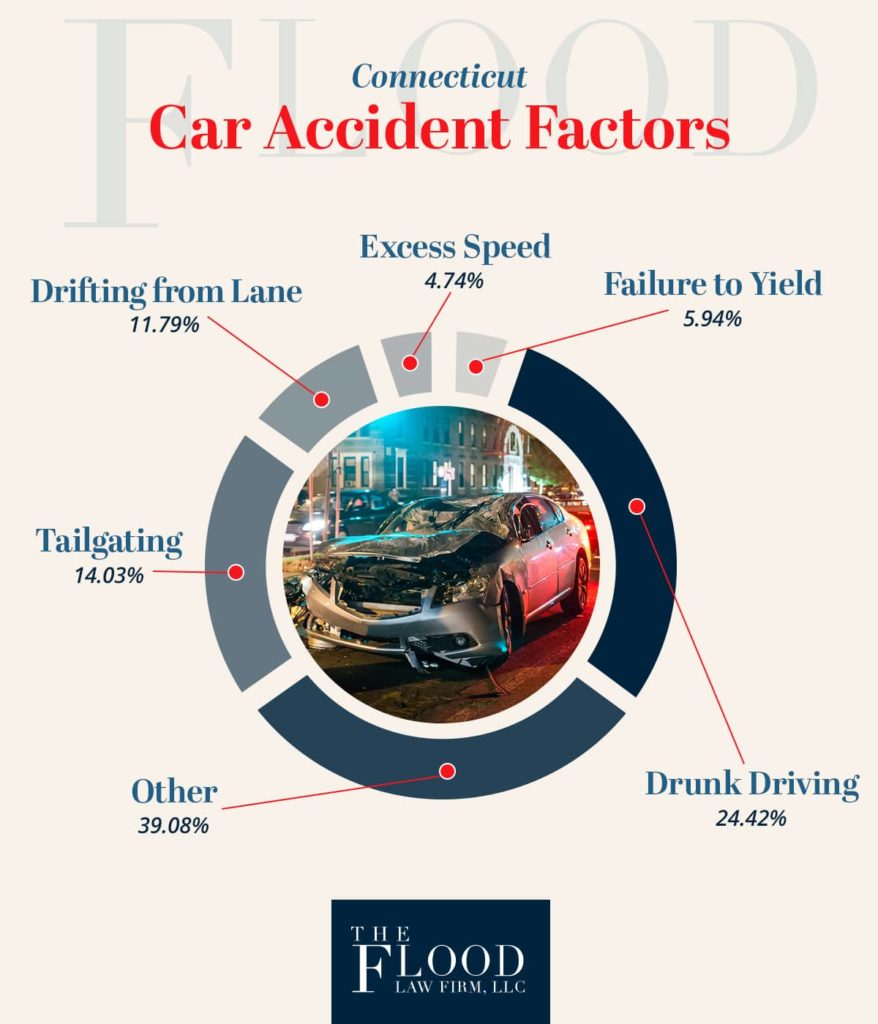
Connecticut Car Accident Factors
The most common cause of car accidents in Connecticut is a driver following another vehicle too closely on the road. We commonly call this “tailgating,” and it is responsible for 14.03 percent of all accidents in Connecticut. It is jarring to learn just how often this maneuver can result in rear-end collisions that leave people with injuries, damaged property, or worse.
Drivers who fail to stay in their lane are the second-largest factor in car accidents here in CT. In 2020, 11.79 percent of accidents occurred because a careless driver drifted into another lane.
Other major causes of car accidents in the last year include:
- Failure to yield right of way: 5.94 percent
- Improper backing: 3.27 percent
- Ran off roadway: 2.15 percent
Speeding
Excess speed accounts for a relatively small proportion of accidents in Connecticut. However, it is still important to recognize how driving too fast can lead to serious and deadly crashes.
The statistics for drivers who ended up in speed-related accidents are categorized as follows:
- Driving too fast for conditions: 3.51 percent
- Exceeding the speed limit: 1.16 percent
- Racing: 0.07 percent
Drinking and Driving
Connecticut recorded 74 deaths from drunk driving accidents in 2020. As such, drinking and driving accounts for 24.42 percent of last year’s total traffic fatalities.
Distracted Driving
Last year more than 5,000 crashes in Connecticut involved some form of distraction. Distracted driving accidents can have a multitude of causes, from talking on the phone and other use of an electronic device to the actions of passengers to distractions outside the vehicle.
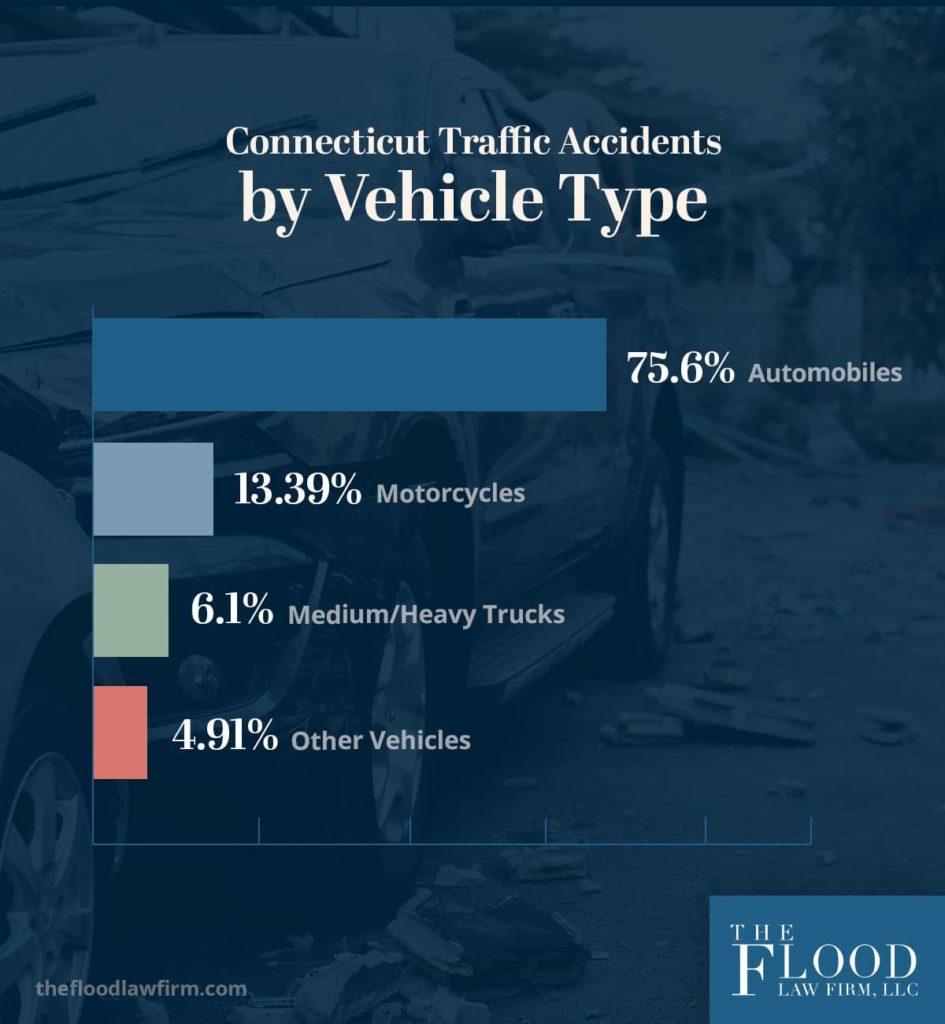
Connecticut Traffic Accidents Deaths by Vehicle Type and Demographics
Statistics show that passenger vehicles are by far the most likely to be in a fatal accident. More than 75 percent of deadly accidents last year involved a passenger car, SUV, pickup truck, or van. After automobiles, motorcycle accidents accounted for 13.39 percent of all fatal crashes.
At about 6 percent, medium and heavy trucks were the third most common type of vehicle involved in deadly collisions. Though they represent a fairly small number of accident deaths overall, truck accidents are devastating events that can result in multiple fatalities.
Car crash statistics also show that males are involved in the majority of Connecticut car accidents resulting in fatalities. Drivers were male in 74.09 percent of accidents involving death, compared to 22.05 percent of fatal accidents where a woman was at the wheel. (The gender of the driver was unknown in 3.86 percent of crashes.
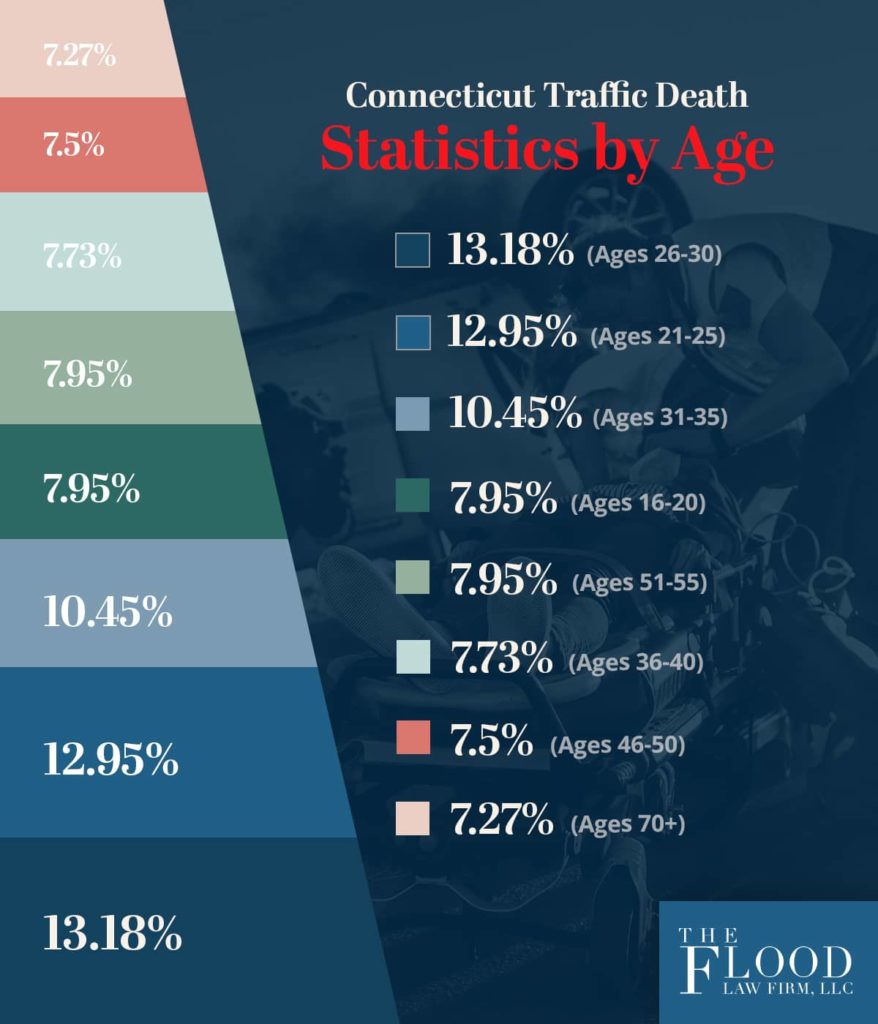
Connecticut Traffic Death Statistics by Age
The age groups most at risk for being in a fatal accident are:
- 26-30: 13.18 percent
- 21-25: 12.95 percent
- 31-35: 10.45 percent
- 16-20 and 51-55: Both 7.95 percent
- 36-40: 7.73 percent
- 46-50: 7.5 percent
- Over 70 years of age: 7.27 percent
A variety of factors contribute to the high rates of accident deaths for people in these age groups. Many people in these ages commute to and from or drive for work; the more time on the road, the greater the likelihood of an accident.
Inexperience is another potential issue that explains the high rate of fatalities in accidents involving drivers in their teens and those in their twenties. On the other end of the spectrum, the increased rate of death in accidents among drivers who are over the age of 70 may be the result of age-related declines in driving ability that increase the risk of a crash.
Connecticut Occupant Traffic Death Statistics by Restraint Use
Seat belts save lives. Nothing proves this maxim better than the fact that 16.48 percent of drivers and 22.58 percent of passengers killed in Connecticut accidents in 2020 were not wearing any type of restraint.
Remember: Always buckle up. Whether you are behind the wheel or along for the ride, wearing a seat belt can literally mean the difference between life and death.
Statistics for the ‘First Harmful Event’
In a car wreck, the collision that causes an injury that proves fatal to a person is referred to as the first harmful event. In 2020, the most common first harmful events in fatal accidents included:
- Collision with a Person, Vehicle, or Non-Fixed Object:
- Collision with a motor vehicle in operation: 38.14 percent
- Collision with a pedestrian: 16.15 percent
- Collision with a bicycle: 1.72 percent
- Collision with a parked motor vehicle: 1.03 percent
- Collision with a Fixed Object:
- Collision with a tree: 8.93 percent
- Collision with a curb: 5.84 percent
- Collision with a guardrail face: 4.47 percent
- Collision with an embankment: 2.75 percent
- Collision with a cable barrier OR Collision with a utility or light pole: Both 2.06 percent
- Non-Collision (Single-Vehicle Accident):
- Rollover accidents: 2.75 percent
- Fell or jumped from vehicle: 1.37 percent
In more than 65 percent of fatal accidents, the first harmful event occurred on the roadway. The next most common locations were the roadside (19.59 percent) and the shoulder of the road (5.84 percent).
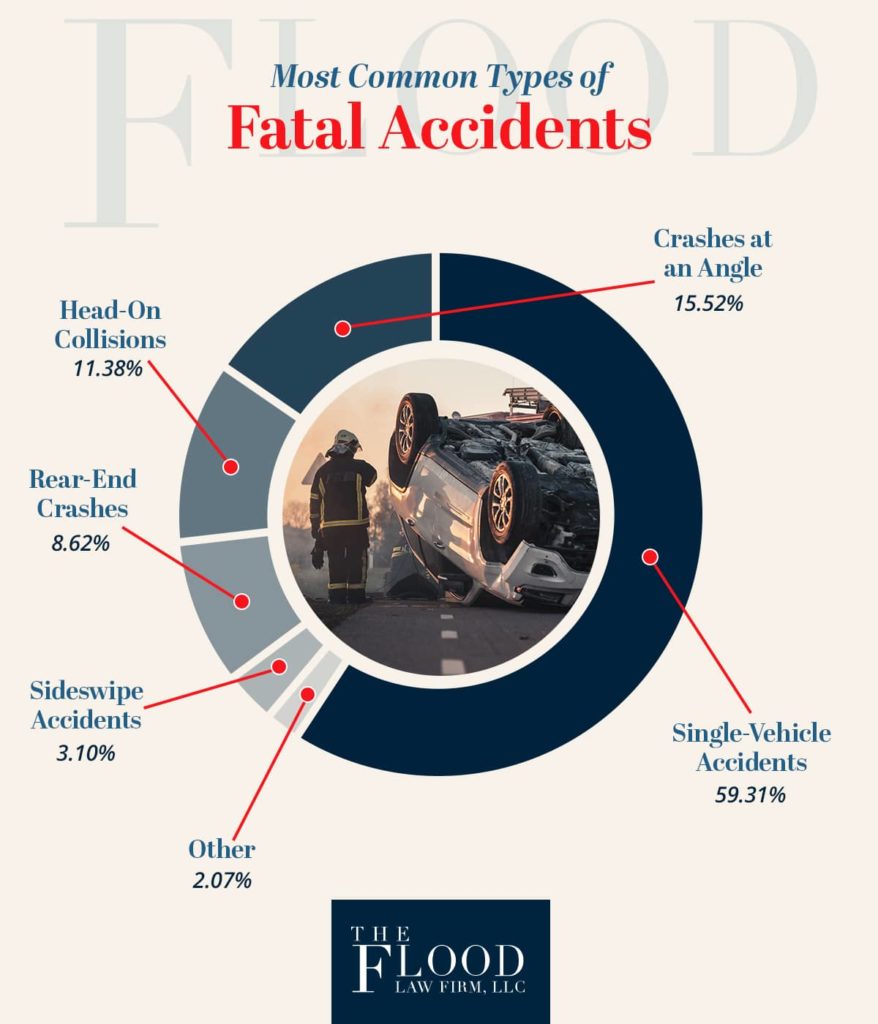
As for the manner of crashes, 59.31 percent were single-vehicle accidents. Crashes at an angle (15.52 percent), head-on (11.38 percent), rear-end (8.62 percent), and sideswipe accidents (3.1 percent) made up the rest.
Statistics for Pedestrian and Bicyclist Traffic Deaths
Pedestrians and bicyclists are among the most vulnerable road users in Connecticut. In 2020, the reported fatalities for these groups in road accidents were:
- Pedestrian accidents: 54 deaths
- Bicycle accidents: 5 deaths
The vast majority of these accidents occurred when a motor vehicle struck the pedestrian (87.04 percent) or the bicyclist (80 percent).
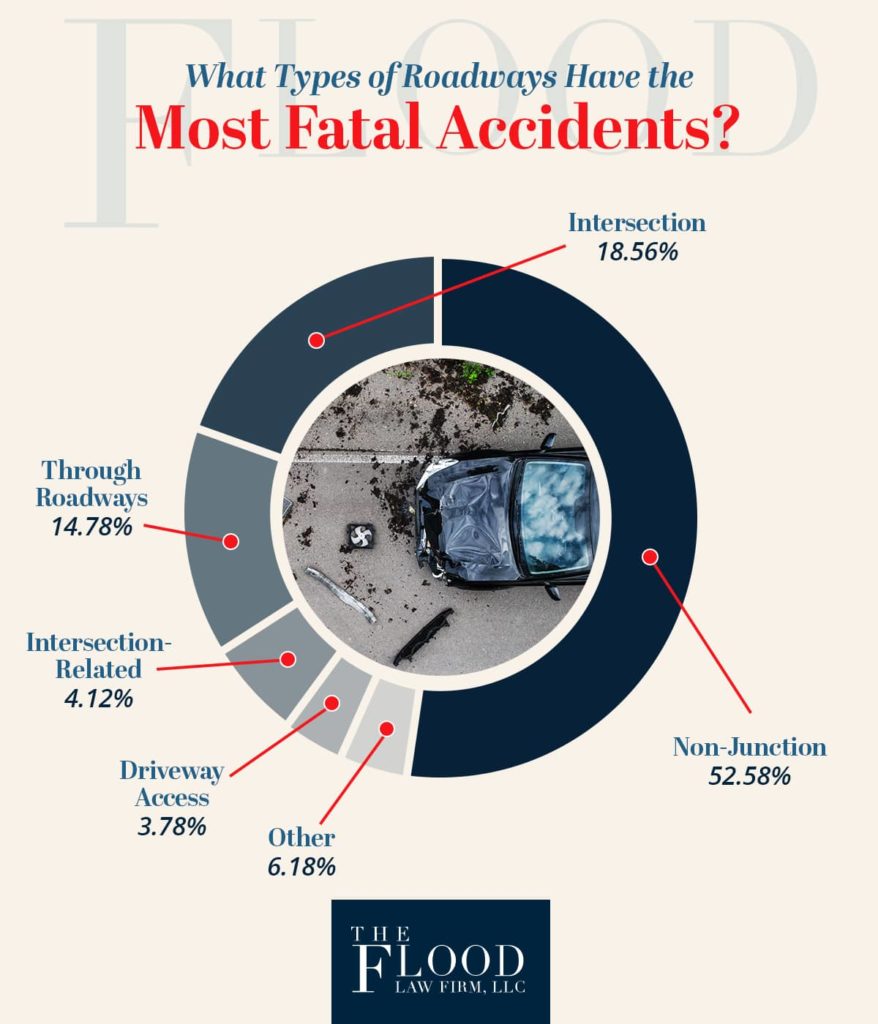
Connecticut Fatal Car Crashes By Road Type
In Connecticut in 2020, more than half of all fatal accidents (55.33 percent) occurred on straight, level roads. Although we commonly associate serious collisions with sharp curves and steep grades, the reality is that driving straight is much more dangerous.
The sections of road with the most fatal accidents are:
- Non-junction: 52.58 percent
- Intersection: 18.56 percent
- Through roadway: 14.78 percent
- Intersection related: 4.12 percent
- Driveway access related: 3.78 percent
Although accidents in intersections make up a relatively small percentage of crashes resulting in death, it is important to be aware of which intersections present the greatest danger. Crashes at four-way intersections accounted for the most fatalities, followed by T-intersections.
Connecticut Statistics for Time and Date of Fatal Crashes
The most deadly days to drive in Connecticut in 2020 were Friday (17.53 percent of fatal accidents), Thursday (17.18 percent), and Saturday (16.49 percent). Driving was most dangerous in the late afternoon and evening, with approximately 36 percent of accident fatalities occurring between the hours of 3 p.m. and 7 p.m.
The deadliest months for driving were November (11 percent of accidents deaths) and June (10.7 percent). However, the single deadliest day in the state was May 1, 2020, when five fatal crashes occurred.
Weather and Lighting Conditions for Fatal Car Accidents in Connecticut
The vast majority (84.5 percent) of deadly accidents in Connecticut occurred when the weather was clear. Rainy and cloudy weather accounted for less than 15 percent of the crashes in which lives were lost.
Likewise, road conditions were clear in the majority of these accidents as well. More than 85 percent of accidents with fatalities occurred on dry roads, while roads were wet in only 12 percent of cases.
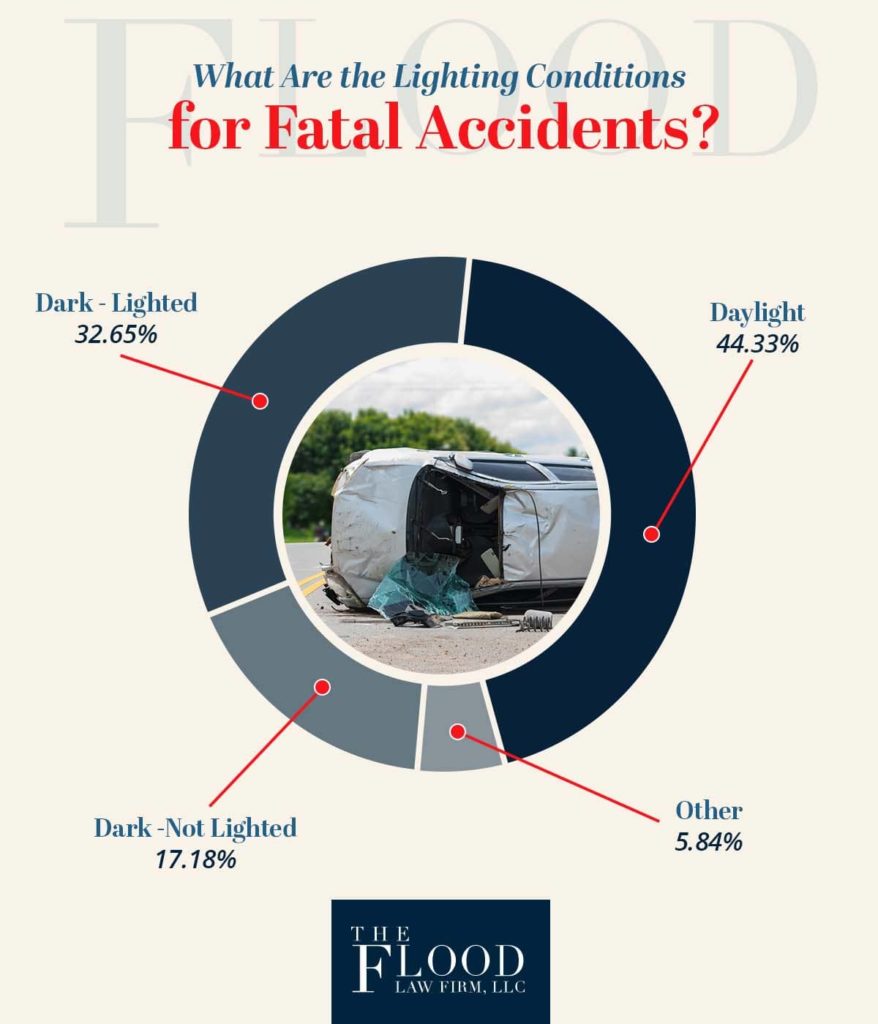
The most common lighting conditions at the time of fatal accidents were:
- Daylight: 44.33 percent of crashes
- Dark – Lighted: 32.65 percent of crashes
- Dark – Not Lighted: 17.18 percent of crashes
Sadly, the number of accidents that occur on dry roads with clear skies in broad daylight suggests that driver error is a much more significant factor in collisions than weather, lighting, and road conditions. As you can see, then, negligence on the part of motorists is a major factor in deadly accidents in Connecticut.
National and Global Car Accident Statistics
According to a preliminary estimate by the National Highway Traffic Safety Administration (NHTSA), 38,680 people in the United States were killed in traffic accidents in 2020. This is a 7.2 percent increase from the number of auto accident deaths in 2019.
The NHTSA also reported a significant increase year over year in the fatality rate by vehicle miles traveled (VMT). Although the VMT decreased sharply in 2020 (largely due to the effects of the COVID-19 pandemic), the fatality rate per 100 million miles spiked to 1.37 – the highest rate of fatalities since 2007.
Early statistics from the NHTSA also show increased fatalities nationwide across a number of accident sub-categories, including:
- Occupant ejection deaths: 20 percent increase
- Fatalities among those aged 25 to 34: 18 percent increase
- Fatalities among those aged 16 to 24: 15 percent increase
- Fatal accidents on urban interstates: 15 percent increase
- Unrestrained vehicle occupant deaths: 15 percent increase
- Fatalities among those aged 35 to 44: 14 percent increase
- Fatal accidents on local/collector urban roads: 12 percent increase
- Fatal accidents on local/collector rural roads: 11 percent increase
- Fatal nighttime accidents: 11 percent increase
- Deaths in speeding-related crashes: 11 percent increase
- Fatal accidents involving alcohol impairment: 9 percent increase
- Deadly accidents on weekends: 9 percent increase
- Single-vehicle accident deaths: 9 percent increase
- Fatal rollover accidents: 9 percent increase
- Motorcyclist fatalities: 9 percent increase
- Bicyclist fatalities: 5 percent increase
Fatal accidents are a global problem as well. According to the World Health Organization, approximately 1.3 million people around the world lose their lives in traffic accidents every year. Worldwide, road crashes are the leading cause of death among children, teenagers, and young adults (ages 15-29).
Contact a Car Accident Attorney Today
Although accident statistics are crucial for experts and lawmakers to make educated decisions about traffic safety, we recognize that they do little good for those who have been injured or lost a family member in a crash. To the team at The Flood Law Firm, you are more than just a number.
Our attorneys have taken hundreds of car accident cases to trial and achieved millions of dollars in verdicts and settlements on behalf of our clients. This experience enables us to account for the unique factors in your claim and develop effective strategies for obtaining a favorable result.
For insurance companies, accident claims are all about the numbers – specifically the corporate bottom line. At The Flood Law Firm, we focus on helping people who need legal guidance and compassionate care and holding insurers and the parties liable for accidents to account.
Please call The Flood Law Firm at (860) 346-2695 today for a free case evaluation. Our car accident lawyers serve clients throughout Connecticut from offices in Middletown, Danbury, Waterbury, and Bridgeport.